
You've got a client application in staging, a scanner license, two test accounts that may or may not still work, and a report due before the next release. It's tempting to point Burp Suite or Nuclei at the login page and call whatever comes back a test. That approach produces alerts, not proof, and it usually misses the flaw that matters most, one user reaching another user's data.
A defensible web application testing process puts multi-account authorization testing and business-flow abuse at the center. Scanners help you find candidates. Your job is to reproduce each one, show who could misuse it, and preserve evidence a client engineer can act on without asking you to repeat the work.
Table of Contents
- Phases of a Web Application Test at a Glance
- Scoping and Authorization Before Any Request
- Mapping the Attack Surface Passively and Actively
- Scanning, Exploitation and Verifying Each Finding
- Evidence Capture and Reports Clients Can Act On
- Running Retests and Continuous Testing for MSSP Clients
- Confirm Scope and Run Your First Pilot Test
Phases of a Web Application Test at a Glance
| Phase | Main question | Key output | Common tools |
|---|---|---|---|
| Scoping and authorization | What is in and out of bounds? | Signed scope, test accounts, exclusions | Scope template, password manager |
| Reconnaissance | What hosts, technologies and services are exposed? | Asset and technology inventory | Nmap, DNS and certificate lookups |
| Attack surface mapping | Which roles, workflows and APIs exist? | Surface map with parameters and roles | Burp Suite, OpenAPI files, browser devtools |
| Scanning and discovery | Where could weaknesses be? | Unverified candidate findings | Nuclei, ffuf, Burp Scanner |
| Exploitation and verification | Can each finding be reproduced and misused? | Request and response proof per finding | Burp Repeater, SQLMap on approved parameters |
| Evidence capture | What must be preserved for the report? | Evidence archive with timestamps and accounts | Burp project files, screenshot tools |
| Reporting and retest | What is the risk and is it fixed? | Risk-rated report and retest result | Report template, retest scripts |
Where Testers Get Stuck
Scoping and authorization is often the longest phase on client-facing work. You're confirming hosts, versions, accounts, exclusions, testing windows and escalation contacts, and none of that feels technical. Skip it and a technically strong test can still fail in the client's eyes because you tested the wrong tenant, hit an excluded service, or can't prove who approved the work.
Attack surface mapping is the next trap. A crawl of public pages isn't a map. You need every role, tenant, state-changing workflow, parameter and API family recorded before scanning starts, otherwise automated checks only cover the paths one account happened to visit.
Don't confuse the middle two phases. Scanning and discovery produces an unverified list. Exploitation and verification turns an item on that list into a finding by reproducing it under controlled conditions. If you can't replay it, you don't report it as confirmed.
Practical rule: No phase is finished until its output exists as a document, file or archive someone else can inspect.
For a broader view of functional and non-functional checks that sit alongside security work, web application testing with Bridge Global is a useful companion read. Use the table above as your checklist for the rest of this walkthrough. If a row has no output yet, you're not ready to move on.
Scoping and Authorization Before Any Request
Don't send a request until this setup is signed. Mistakes here are cheap to fix on paper and expensive once traffic hits a live system.
The Setup Routine
- Get written authorization: Name the asset owner and approver, and record the approval date. Verbal permission from a developer who doesn't own the asset isn't authorization.
- List the exact scope: Record every in-scope host, API base URL and application version. Separately list excluded hosts, including third-party SaaS, hosting and telecom services that need their own testing permission.
- Create accounts per role and tenant: Provision at least one account for each role in each tenant. Cross-account authorization tests later are impossible if everyone shares one admin login.
- Agree safety limits: Set request rate, testing windows, whether production is allowed, and which payloads are off limits, such as destructive SQL or mass data changes.
- Set the escalation path: Name who you call, how fast they respond, and what triggers an immediate stop, for example rising error rates or service instability.
This order reflects NIST Special Publication 800-115, which describes penetration testing as planning, discovery, attack, and reporting, and states that no actual testing occurs during planning. Rules of engagement, documented management approval and testing goals come first. Logs and periodic updates follow during discovery and attack.
If you're still separating general security testing from an authorized penetration test in your statement of work, compare security testing scope and methods before you draft the scope sheet. Our own penetration testing requirements checklist covers the same ground from the engagement side.
A Concrete Scope Sheet
Say you're testing a multi-tenant SaaS billing app. Your one-page sheet names two tenants, two users per role (admin, standard user, read-only), the staging host and API base, and one hard rule, only the test tenant's data may be changed. Payments run through an excluded third-party processor, so you test the handoff, not the processor.
That discipline matches how we work. Tests run only against targets the customer defines and authorizes, and scope, testing mode and schedule are set before anything launches. For each engagement, the customer must confirm and attest that they're authorized to test the specified targets and scope. Get the sheet signed, file it with the account list, and only then start mapping.
Mapping the Attack Surface Passively and Actively
The old API version is where this phase usually earns its keep. The illustration below shows the shift from quiet observation to deliberate probing that a good mapping pass follows.
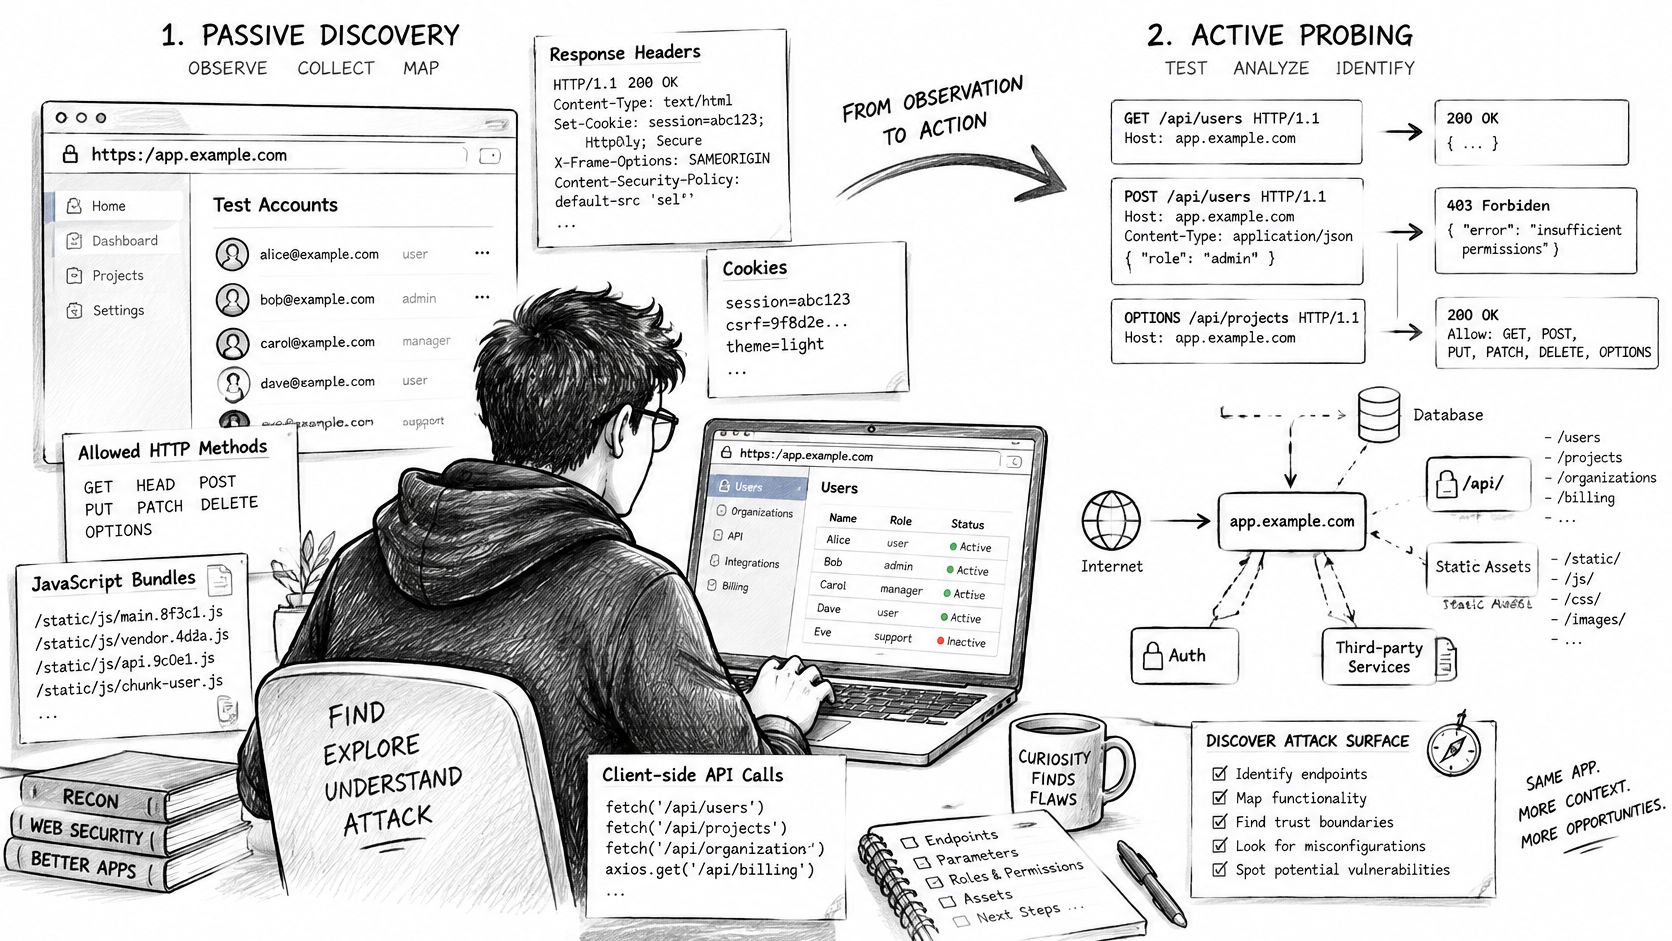
Say the browser UI calls /api/v2/invoices and returns invoice ID, total and status. While browsing passively as a standard user, you spot a JavaScript bundle still referencing /api/v1/invoices/{id}, the route an older mobile build uses. You request the same invoice through v1 and get back the customer's tax ID and internal notes as well. Nothing has been exploited yet. You've found a second endpoint family with different field-level behavior, and it wasn't in the OpenAPI file the client sent you.
Passive Discovery First
Browse the application as each test account and record what it reveals without attacking it. Note response headers, cookies, allowed HTTP methods, JavaScript bundles and the API calls the front end makes. Compare the OpenAPI file or GraphQL schema against observed traffic, because undocumented, deprecated and older versions routinely differ from the documented surface.
Active Discovery Second
Run an authenticated crawl that records every state-changing request, then enumerate directories and parameters with ffuf against approved wordlists. Run Nmap port checks only on in-scope hosts. You're not hunting vulnerabilities yet, you're proving which endpoints, methods and parameters exist so later tests have somewhere to land. A structured attack surface mapping method helps keep that inventory consistent across engagements.
The short walkthrough below shows how passive observation and active probing fit together in practice before you build the final map.
What Good Looks Like
Record each role, tenant, object type and workflow in a surface map, with parameters and preconditions attached to every entry. Who can create an invoice, who can approve it, what state must it be in, and which endpoint performs each step.
A finished map lists every role, every state-changing action and every endpoint family, plus an honest note of what remains unknown.
That unknown column matters. If you couldn't reach the password reset flow because email delivery is disabled in staging, say so now. A gap you declare during mapping is a scope conversation. A gap a client finds in your report is a credibility problem.
Scanning, Exploitation and Verifying Each Finding
Automated tools produce candidates, not findings. Treat every scanner alert as a hypothesis until you've reproduced it by hand and shown what an attacker gains.
The OWASP Top 10 2021 data collection covered 515,000 applications, and it tells you where to look first. Broken access control ranked first, appearing in an average of 3.81% of tested applications with more than 318,000 mapped occurrences. Injection was tested in 94% of applications and security misconfiguration in 90%, so authorization, input handling and deployment configuration all deserve deliberate coverage, not just a scanner pass.
| Test area | How to verify | Evidence to keep |
|---|---|---|
| Injection (SQL, XSS, command) | Send controlled payloads to one parameter at a time and compare responses | Request, payload, response excerpt, timing difference |
| Broken access control | Replay the same object request with a second user account and an unrelated tenant | Both responses side by side, account IDs used, object ID |
| Authentication and session | Test lockout, token reuse after logout and session fixation | Steps taken, token state before and after, timestamps |
| Security misconfiguration | Check debug pages, default paths, verbose errors and missing security headers | Header dump, screenshot of error page, affected URL |
| Business logic | Repeat a coupon, transfer or invitation flow out of order or at volume | Sequence of requests, account state before and after |
The Verification Routine
Run Nuclei templates and Burp Scanner across the mapped surface, then work each candidate in Burp Repeater. Reproduce the original request, change one variable at a time, replay it with the second account, and confirm the impact. Can that account read, change or trigger an object it shouldn't reach.
Say a scanner flags possible broken access control on an invoice endpoint. You request invoice 1042 as User A, its owner, then replay the identical request as User B in another tenant. User B receives the full invoice body. That's proof. A bare 200 response wouldn't be, because plenty of applications return 200 with an empty object or an error payload.
Use SQLMap only on parameters already approved in scope, with the rate and payload limits you agreed. Our tests cover OWASP Top 10 vulnerabilities, SQL injection, XSS, authentication flaws and misconfigurations, and the engine orchestrates +60 pentesting tools, including Nmap, SQLMap and Nuclei, but tooling breadth doesn't replace this manual confirmation step.
Apply one inclusion rule to every item. A finding joins the confirmed list only when it has a reproducible exploit path, an affected endpoint and parameter, stated preconditions and an impact statement. Anything missing one of those stays a candidate, and you say so plainly.
Evidence Capture and Reports Clients Can Act On
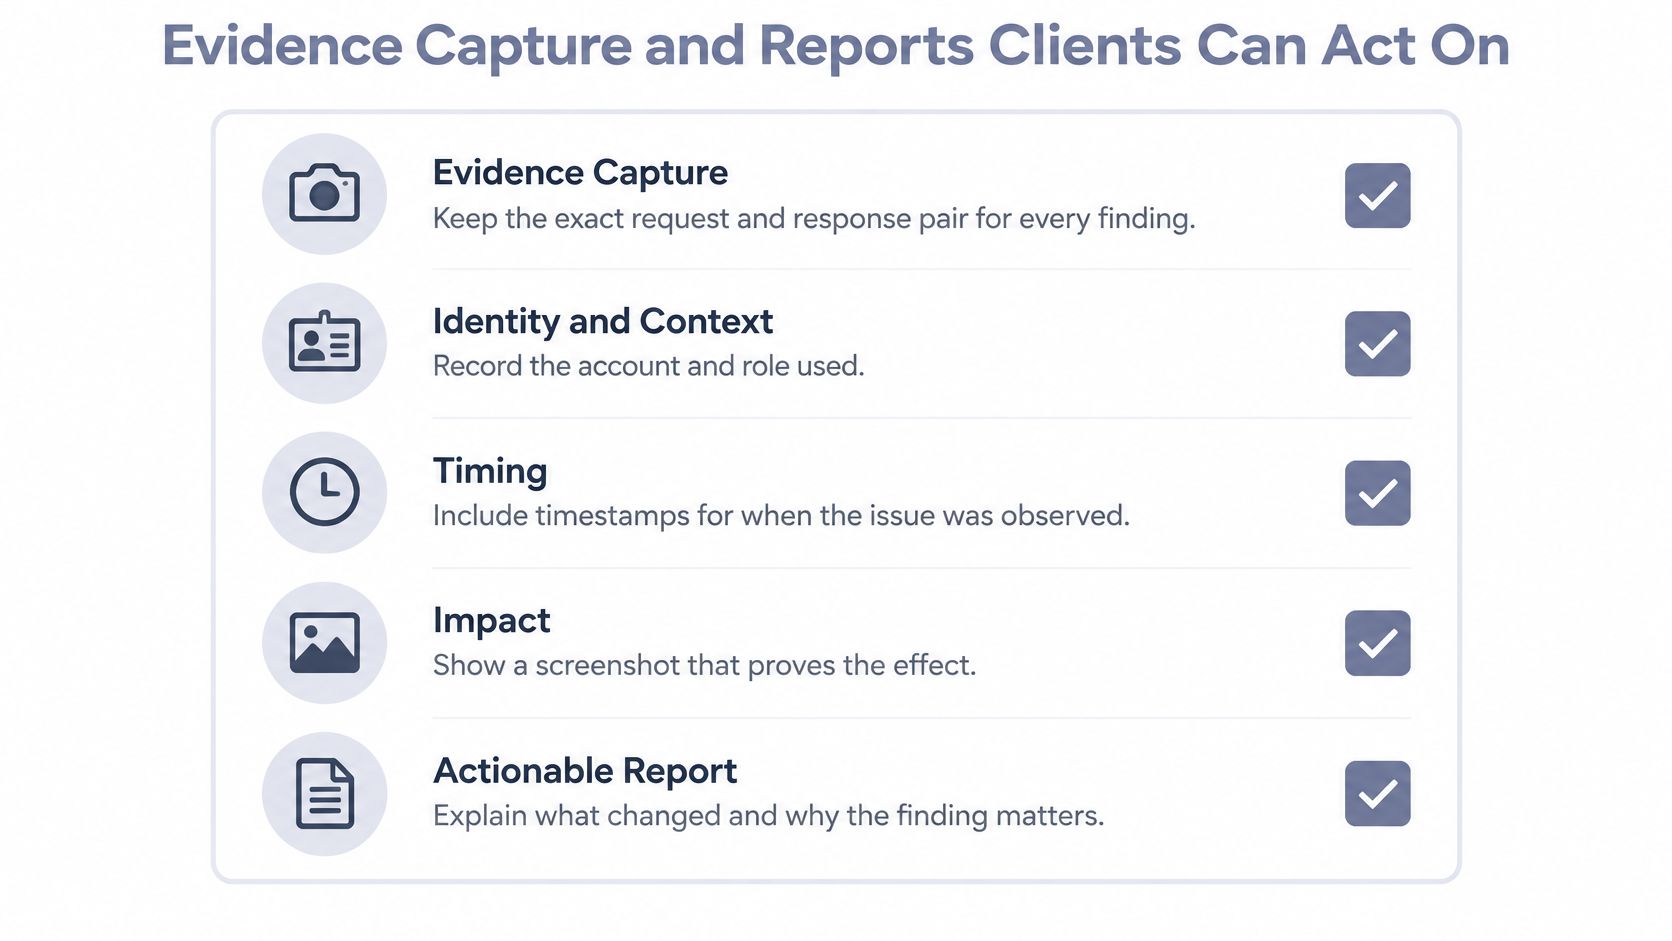
Clients don't fix findings they can't reproduce. The checklist below is the minimum evidence set for every confirmed issue in your web application testing process.
The Evidence Checklist
- Exact request and response pair: Answers the engineer's first question, what did you send.
- Account and role used: Shows which principal performed the action and which one shouldn't have been able to.
- Timestamps: Lets the client correlate your test with their server and WAF logs.
- Screenshot showing impact: Proves the effect in the UI when a response body alone is ambiguous.
- Reproduction steps: Gives a client engineer a sequence they can follow without your Burp project open.
- Impact statement in business terms: Translates a technical flaw into exposed records, altered balances or abused workflows.
- Severity on a stated scale: Tells the client what to fix first and why you ranked it there.
- Concrete fix: Names the control to add or change, not just the weakness to remove.
Write the report while testing runs, not after it ends. Logs rotate, sessions expire and screenshots get lost, and reconstructing evidence a week later produces the vague findings clients push back on. A consistent penetration testing reporting structure makes that concurrent writing much easier to sustain.
Report Structure That Works
Open with an executive summary covering overall risk and the top issues in plain language. Follow with a technical section holding one entry per finding, each carrying the full checklist above. Close with an appendix containing the surface map and tested accounts, plus a retest column that starts empty and fills in as fixes are verified.
If you're delivering as an MSSP, add a compliance mapping column when the client needs PCI DSS, SOC 2 or ISO 27001 references. Cite the specific control the finding touches. A general framework label tells an auditor nothing and tells the engineering team even less.
Model finding: As standard user B in Tenant 2, I replayed the request for invoice 1042 owned by Tenant 1 and received the full invoice, including customer tax ID. Any authenticated user can read any tenant's invoices by changing the object ID. Enforce tenant ownership checks server-side on every object request.
That paragraph works because it names the actor, the object, the data exposed and the fix in four sentences. If your findings don't read that clearly, the evidence underneath them usually isn't complete yet.
Running Retests and Continuous Testing for MSSP Clients
An annual pentest doesn't cover an application that ships every week. The test was accurate for the build you examined. It says nothing about the endpoint added last Tuesday or the role model changed in the latest sprint.
Where the Pentest Fits
Place testing across the lifecycle instead. Set security requirements and threat models during design, run code review with SAST and dependency scanning in builds, then DAST in staging. Manual penetration testing comes after those automated checks, against the release candidate, concentrating on deployed functionality, integrations, authorization boundaries and business logic that scanners can't judge.
Front-end changes deserve the same regression discipline. A practical guide to visual regression testing shows how teams catch unintended UI changes between releases, and the habit transfers directly, compare what changed, then retest what the change touches.
The Retest Routine
- Rerun the original exploit: Use the exact request, account and object from the report.
- Try adjacent variants: Test other roles, other object IDs and the alternate HTTP method on the same endpoint.
- Mark closed only after both pass: A fix that blocks one object ID but not the next one isn't a fix.
Don't wait for the annual engagement when the surface changes. A new endpoint, a new tenant type or a changed role model should trigger a targeted test of that change and its authorization boundaries.
Closing a finding because code changed isn't verification. Closing it because the original exploit and its variants now fail is.
Running This Across Clients
Reuse the account matrix and surface map from the previous engagement and update them, rather than rebuilding from zero each time. Tier clients by how often their applications change, so fast-shipping products get frequent targeted tests and stable ones get deeper periodic ones. Report retest outcomes with fixed and open items side by side, so clients see progress and remaining exposure in one view instead of hunting through two documents.
Confirm Scope and Run Your First Pilot Test
You don't need a full program to start. Run one small, complete pass this week and learn where your process breaks.
Three Steps This Week
- Pick one application: Choose a client app with a staging environment and a known set of roles. Small and well understood beats large and impressive for a pilot.
- Write and sign the scope sheet: Include two test accounts per role, the exclusion list and the safety limits, and get the asset owner to sign it. Confirm the customer defined and authorized every target before any request is sent, and record that confirmation with the signed scope.
- Run the pilot pass: Map the surface, run automated checks, verify three findings by hand, and write the evidence for each one in the report format from the previous section. Three fully proven findings teach you more than thirty unverified alerts.
Keep the toolkit simple. Use Burp Suite for mapping and replay, Nuclei for candidate checks, and a shared spreadsheet as the evidence archive with one row per finding. I'd resist adding more tools until the pilot shows a gap they would fill.
When pilot findings look wrong, check the account matrix and request timestamps first. A request replayed under the wrong account, or with an expired session, produces misleading results that look exactly like authorization failures or false negatives.
If you'd rather see the workflow run before building your own, you can create a free account through the registration portal, explore the platform and run a test pentest to see results firsthand, or request a demo for a full platform walkthrough. Either way, judge the output by the standard in this guide, reproducible proof per finding.
ThreatExploit AI automates reconnaissance, scanning, exploitation, verification and reporting for web applications and APIs, so your team can deliver evidence-backed, compliance-mapped pentest reports without adding senior testers. If you're building a repeatable web application testing process for your clients, visit ThreatExploit AI to see how the platform runs authorized tests end to end and produces reports your clients can act on.